Fusion Retail Analytics
Finastra
Within a few weeks, Fusion Retail Analytics allows users to derive business and financial insights and assess the organization’s performance. It empowers a controlled dissemination of details through sophisticated access controls and allows the leaders to have a consolidated view of their business.
Digital insights are essential to manage financial performance. They must be granular and from multiple sources to drive business decisions. The increased frequency of custom insights from business users has forced the evolution of a platform where users can derive their own insights and build custom dashboards.
Off the shelf insights
The inability to handle modern data complexity leads executives to take non-data backed decisions. Fusion Retail Analytics offers exhaustive pre-packaged dashboards to assess business and financial performance and generate detailed insights across various dimensions.
Quickly build custom insights
The application provides a semantic data model which allows the end user to create their own reports / dashboards through self-service and overcome the delay that Business Managers experience when retrieving information, which impacts their ability to analyze specific details or trends.
Designed for flexibility & cross source extension
Use a modern data platform that enables flexible deployment, and is capable of ingesting data from multiple data sources to provide a consolidated view, e.g., integrate loan origination details, customer service details, risk details etc.
General information
How it works
Off the shelf insights
Use the pre-configured reports and dashboards and the embedded analytics with a role-based access control.Quickly build custom insights
Helps retrieving actionable insights to improve business performance and deliver more value to the consumers.Designed for extensibility & flexibility
Supports integration of external data sources through batch or events-based ingestion, providing a secure platform with flexibility to anonymize data before hosting on cloud.
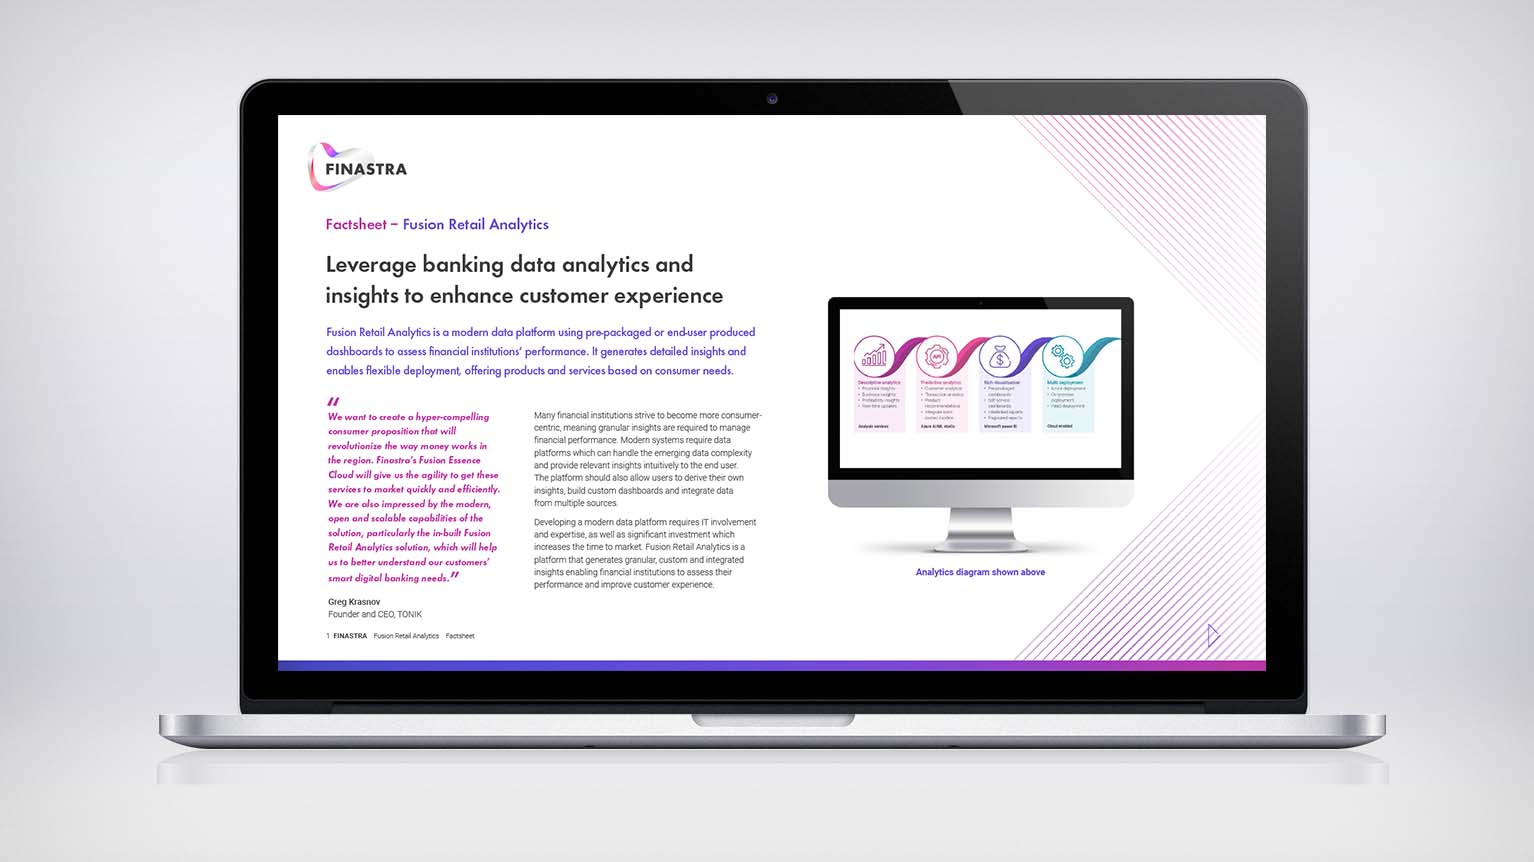
How it looks
Head of Products Dashboard – Deposits & CASA
Evaluate business growth, customer profile as well as other analytics such as financial performance of the overall deposit book or individual product over time, overdraft penalties, profitability, and limits. Show lessBalance Sheet
Bank or Branch level balance sheet for a selected date and its comparison over historical period. Show less


Churn rate
Measures your company's loss in subscribers for a given period of time Videos
Resources